Meet the high performance drillhole visualization QGIS plugin
A solution for drillhole data visualization, management, and edition.
Openlog Premium
If you enjoy OpenLog Community and aim to push its capabilities to their full extent, our Premium packages offer an enhanced experience with early access to new features, a managed database, and dedicated end-user support.
Features
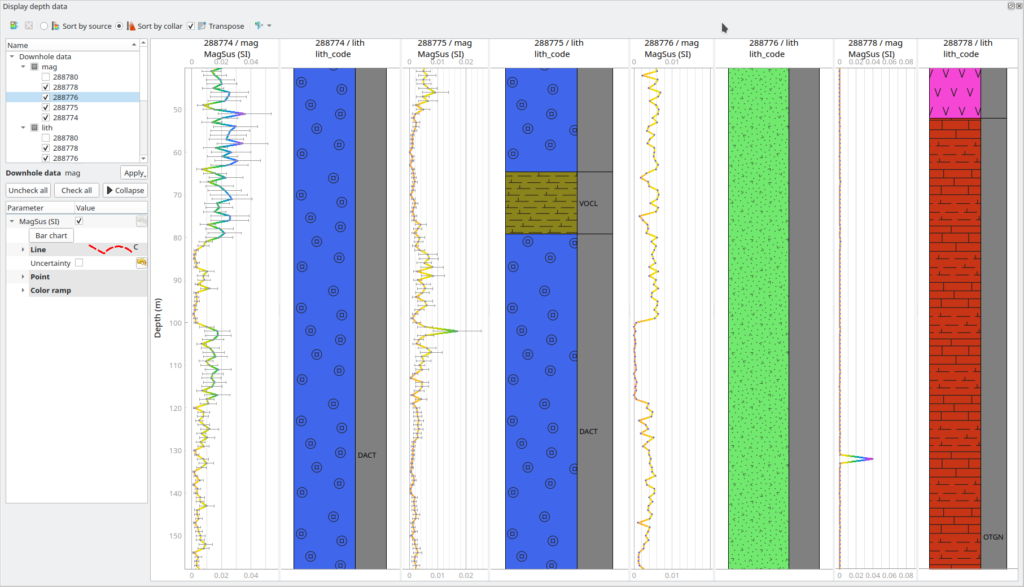
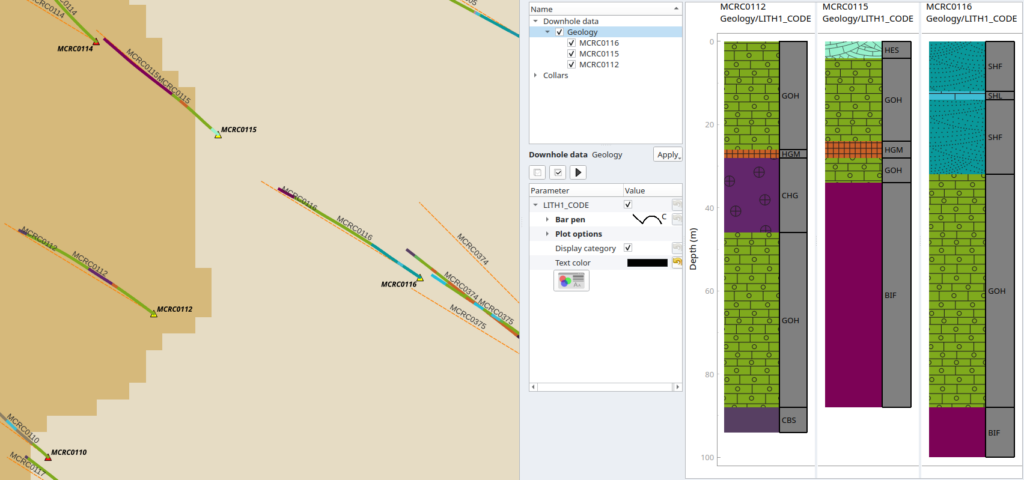
Striplogs
- Display time and depth domain data series
- Combine numerical, categorical, interval types
- Explore your data with a comprehensive suite of symbology options
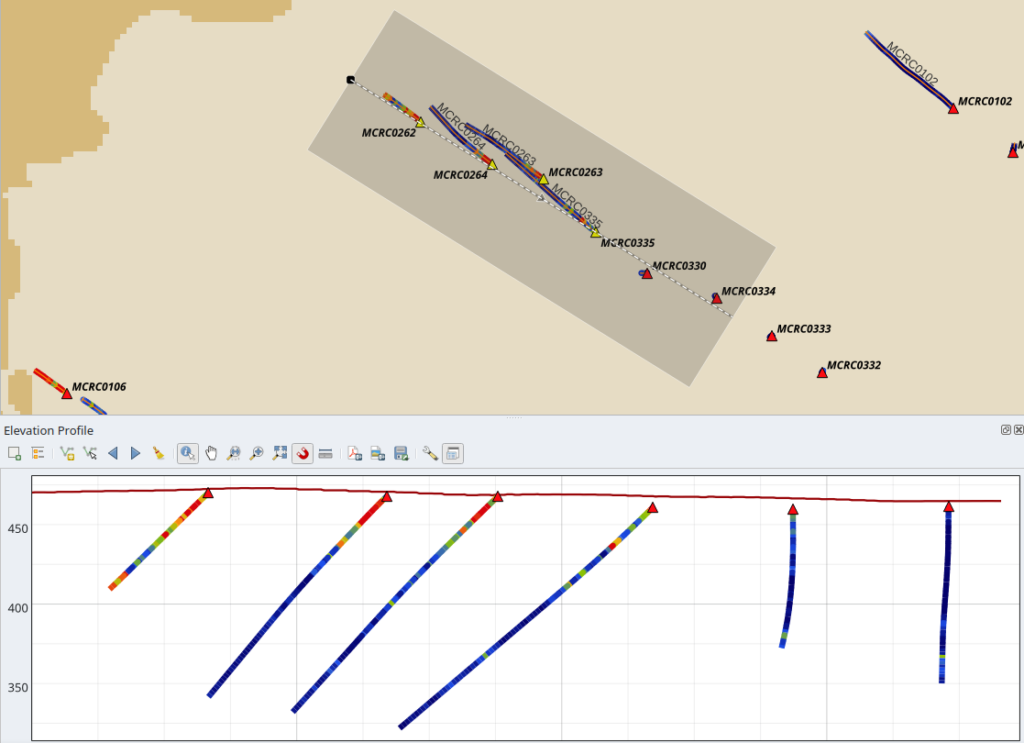
Cross-sections
- Digitize cross-section traces freely
- Project drillhole paths and color coded data series onto the section plane
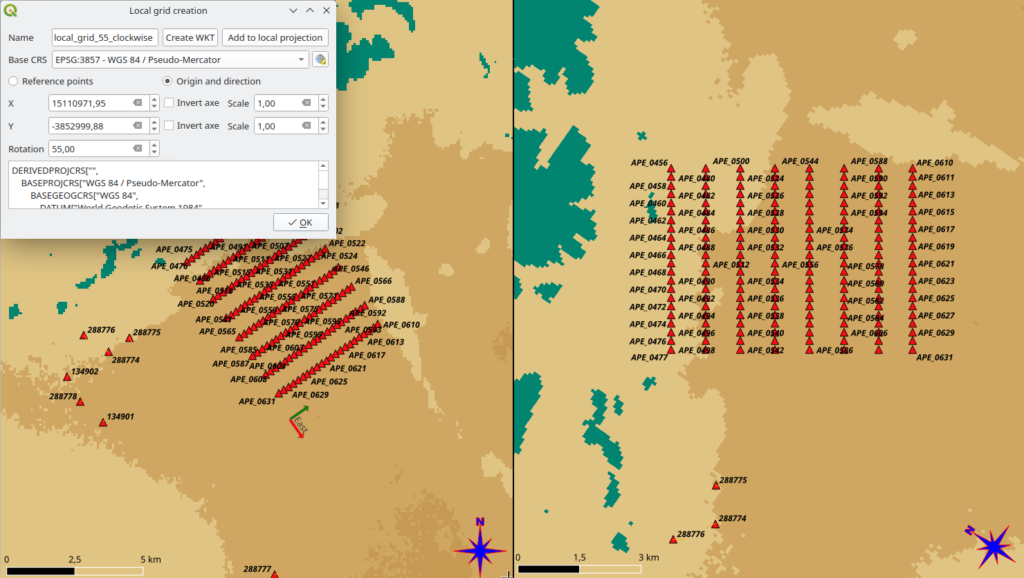
Planning
- Setup your collar placement more efficiently with OpenLog’s customized point grid wizard
- Define your own local CRS to line up with relevant structures
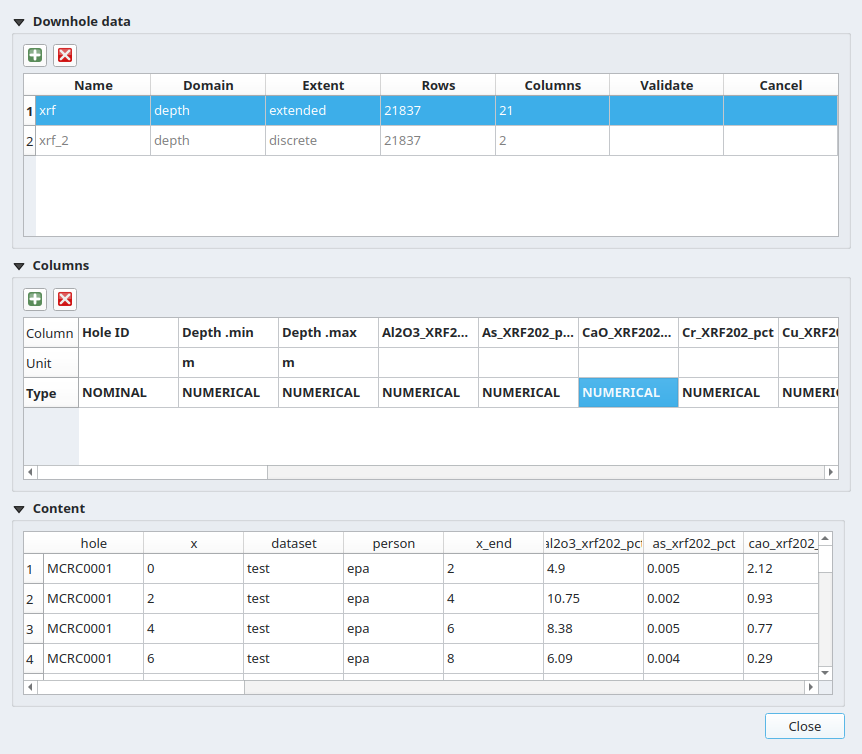
Drillhole Database
- Free your data from vendor-locking with Xplordb
- Pick the Spatialite version for immediate results on small projects
- Scale to the PostGres version for robustness on ongoing operations
- Always: benefit from the superior performance of a true geospatial database
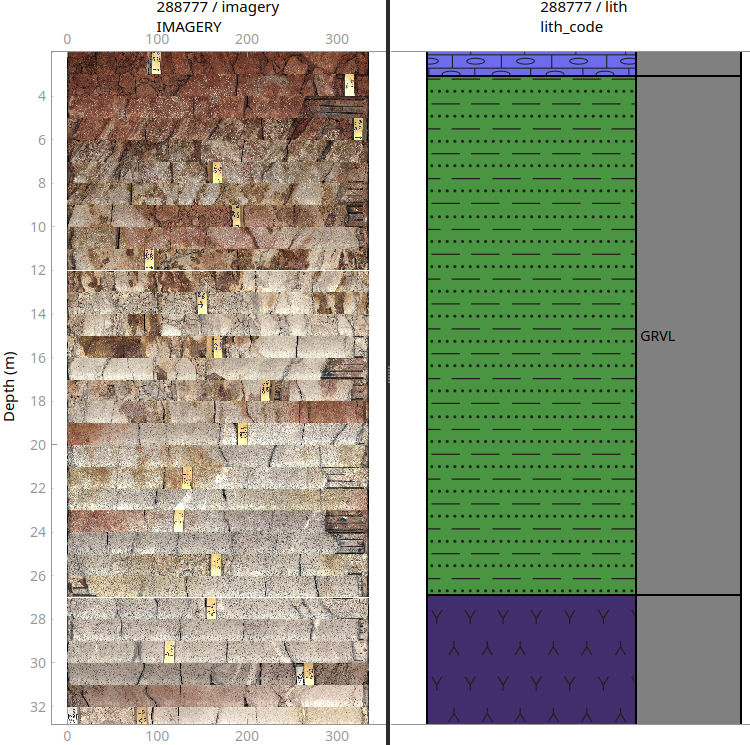
Core Imagery
- Import core imagery files into xplordb
- Display core imagery in log viewer
Map view
- Project drillhole paths and color coded data series onto the map
- Compare planned vs effective traces
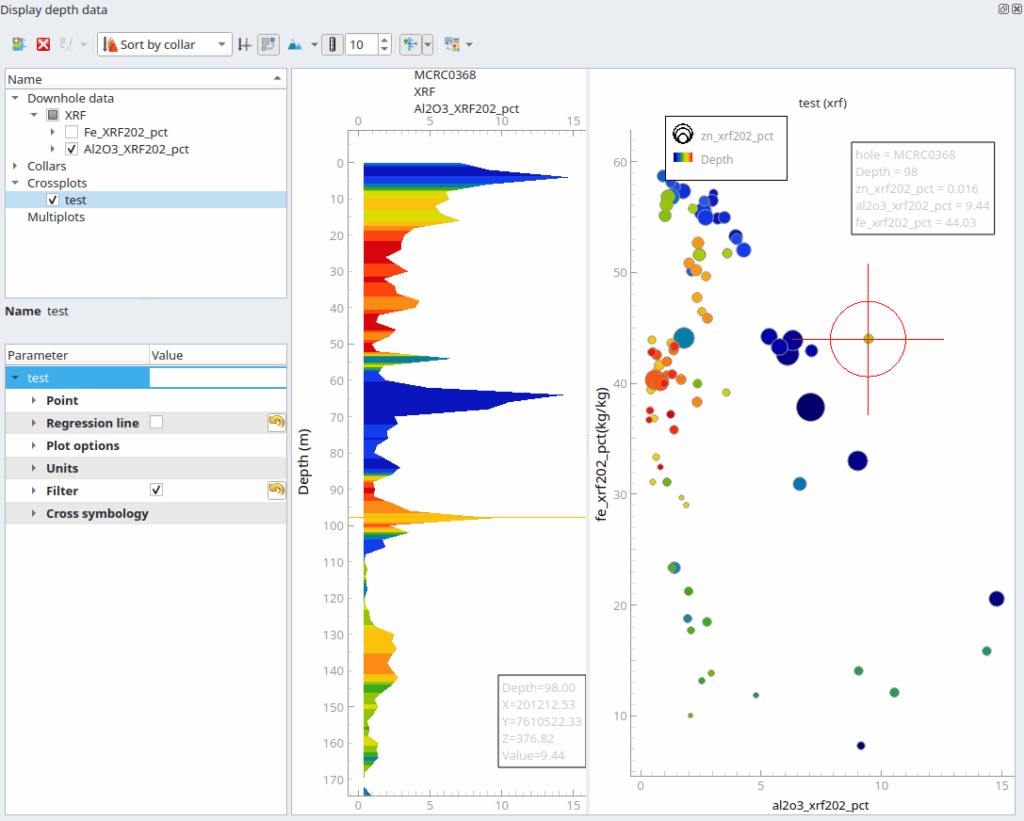
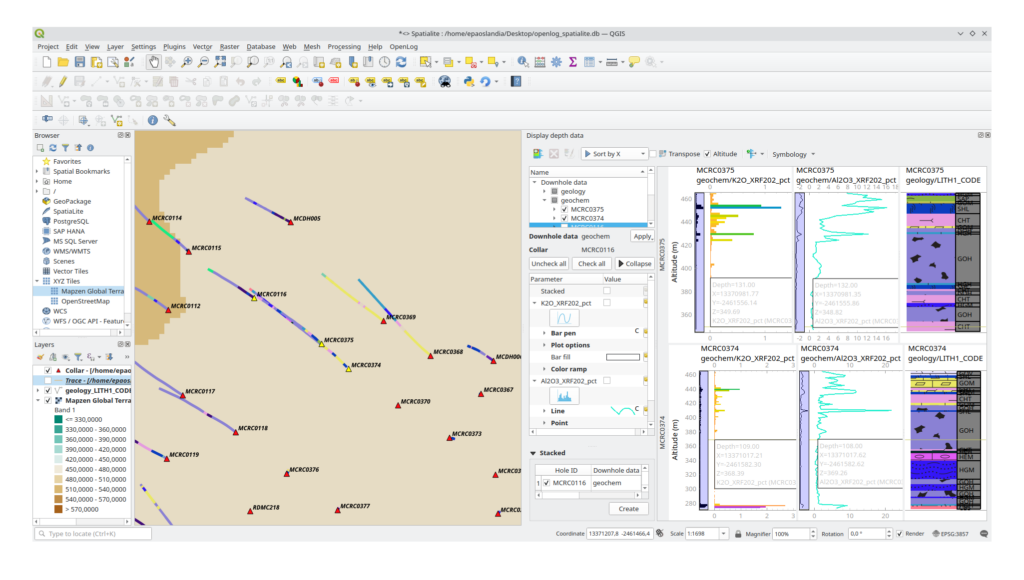
Advanced data viz
- Plot numerical variables against one another
- Display multiples variables on the same graph
- Define grade bins with curve shading
- Inform decisions with detection limits and error bars
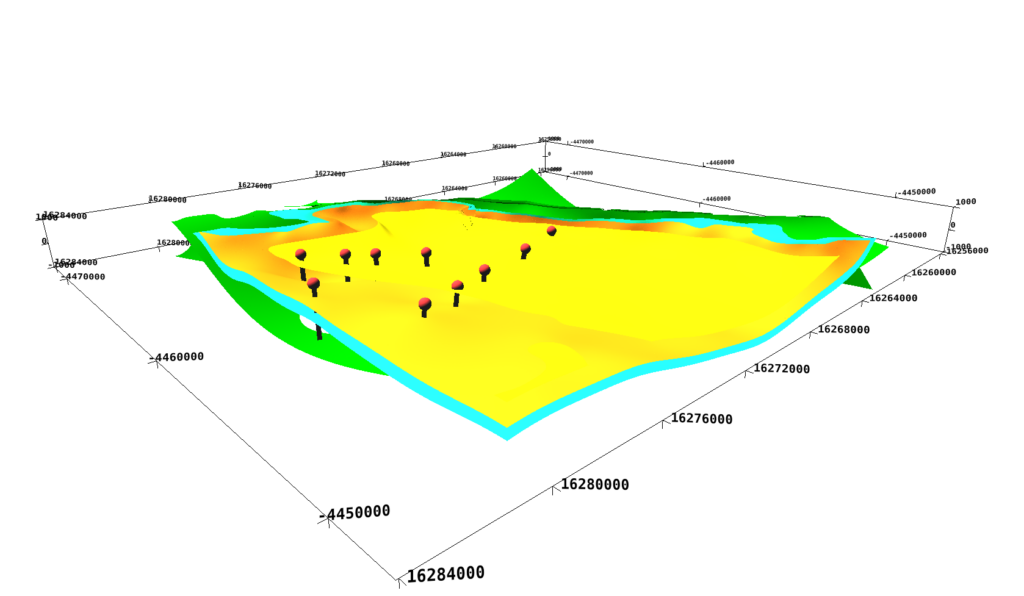
3D viewer
- Display drillhole geometry
- Propagate log and cross-section symbology*
- Explore arbitrary surfaces*
- Set bounding box via map digitization
- Render 3D grids*
- Project imagery onto sections*
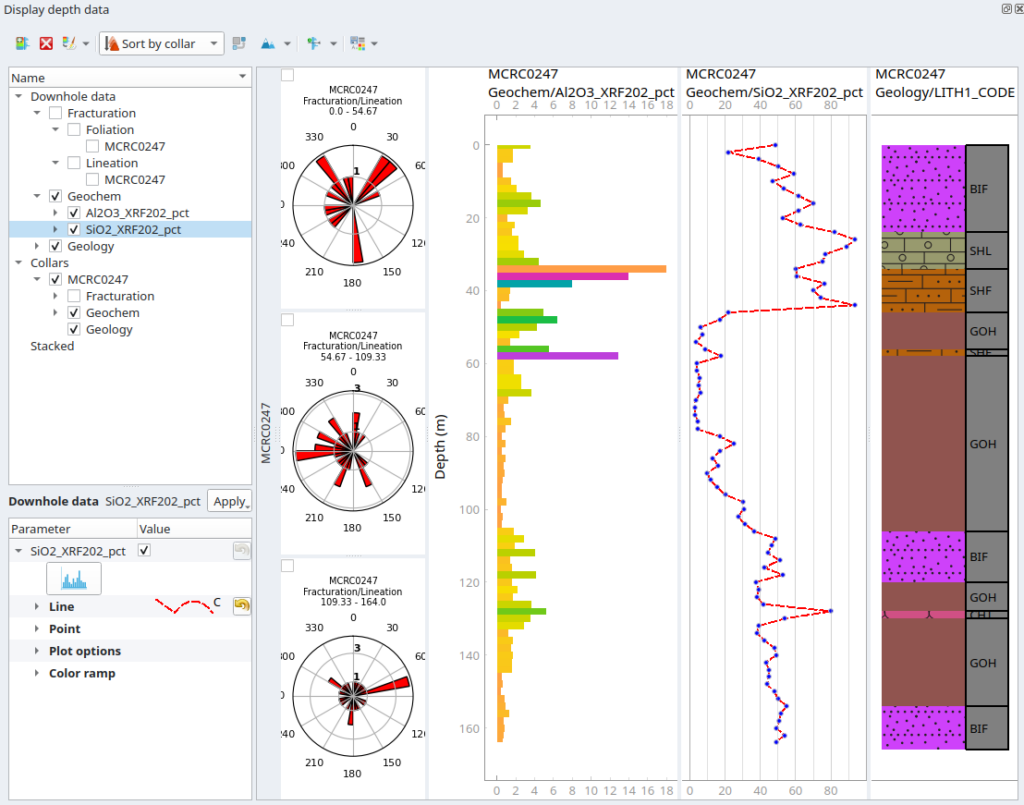
Structural data viz
- Display planes and lines over rose diagrams and stereonets
- Distinguish between planned and effective surveys
- Gain quick insight with tadpoles
- Project structures over imagery*
XplorDB Online
- Manage your online drillhole database
- Define user privileges and access
- Stream new data in real-time
- No vendor-locking, no invasive logs, no AI training
*upcoming features, see our milestones for additional information
Subscription tiers
Solo
Single user
200€* p.a
Everything in Base +
- Premium plugin
- Training center
Team
Up to 10 users
1,600€* p.a
Everything in Solo +
- Xplordb Online
- Priority support
Partner
Up to n users
User variant
Everything in Team +
- Private support
- On-premise
* excluding GST
Why premium?
To gain access
No Premium subscription, no Premium features, simple.
To make those dollars count
Apeiron is a small team of engineers, every dollar contributed to OpenLog goes towards developing or promoting it.
You membership funds engineering directly, it is not rent.
To keep it going
OpenLog Community is free to use but it is certainly not free to make. In order to keep the lights on, reliable funding is required.
Without that we cannot add features, improve existing ones, fix bugs, or provide support.
To get, and keep, what you paid for
OpenLog Premium features eventually make it into the Community as per the delayed Open Source model professes which all may enjoy.
With your membership, you are freeing yourself and others from the proprietary software licence fee ratchet.
FAQ
How to install OpenLog Premium?
Provided you have already installed OpenLog Community, go to OpenLog -> Settings and fill in your plugin credentials there.
There is nowhere to input my credentials in the Settings window.
You are most likely running an outdated version of OpenLog Community which is not compatible with your Premium subscription. This is usually due to an outdated install of QGIS itself.
Please install the latest version of QGIS and reiterate the standard Openlog installation procedure then.
Are all new features Premium?
All new features are Premium. This excludes bug fixes.
How do Premium features relate to Community ones?
Premium version features extend, improve, or add features over the Community version.
Will Premium features be included in Community
Yes, all Premium features eventually find their way into the Community version.
How long does it take for a Premium feature to be published into the Community version?
There is a 24 months Delayed Open Source Publication waiting period between the release of a Premium feature and its port to the Community version.
How do I get an invoice for my Premium subscription?
You will receive an invoice via email automatically once the transaction is made. You may also retrieve it from your online account.
I have not received my invoice.
There is up to an hour delay before your invoice is sent. If required you may log in to your online account.
How do I get my Premium credentials?
Once we have received your payment, temporary credentials are sent via email along with relevant instructions.
I have not received my Premium credentials.
There is up to a 24h delay before your Premium subscription is active. If you have been waiting for that long, contact support.
What happens when my subscription runs out?
You will retain access to your account and all the Premium features you had unlocked. New Premium features or improvements upon existing ones will not be made available until you renew you subscription.